
Introduction
In low- and middle-income countries, small-scale farms may account for between 50% and 70% of the food supply, depending on the definition adopted for small-scale farming[1,2]. Beyond food production, they provide income, employment, and social support, especially in regions like eastern DRC where agriculture is the main source of subsistence and resilience against economic and environmental shocks [3].
In the high-altitude zones of South Kivu, this dependence on agriculture is even more pronounced due to limited opportunities for livelihood diversification and the predominance of land-based subsistence strategies [4]. Households typically cultivate small, fragmented plots on steep hillsides where demographic pressure, land scarcity, and a history of displacement and insecure tenure intensify competition for fertile land. Most mountainous agroecosystems are inherently fragile and increasingly exposed to severe environmental stressors. Steep slopes and intense seasonal rainfall enhance soil erosion, stripping away nutrient-rich topsoil and progressively reducing land productivity over time [5,6].
Continuous land degradation in South Kivu is driven by deforestation, repeated cultivation without soil restoration and minimal organic matter inputs, which deplete soil organic carbon and nutrients, reducing fertility and yields [7,8]. Low-input farming systems, limited access to fertilizers, and increasing climate variability further constrain production, with smallholder farmers reporting erratic rainfall patterns that disrupt growing seasons and heighten risks [9]. These shocks often force resource-poor households into unsustainable coping strategies, perpetuating soil degradation and yield losses [10]. [11,12] support this assertion, highlighting that these shocks disproportionately affect resource-constrained households, whose adaptive capacity remains limited by inadequate access to resources and technologies, with adverse consequences for soil fertility and agricultural yields. The combined pressures of environmental degradation, nutrient depletion, and climatic instability threaten agricultural viability in the region [13,14], particularly on steep slopes where erosion accelerates topsoil loss [15]. These conditions underscore the urgent need to improve land management and promote sustainable farming practices capable of restoring soil health, protecting fragile ecosystems, and strengthening farmers’ adaptive capacity. Sustainable farming practices have been widely recognized as a key measure to reverse soil degradation, enhance ecosystem services, and build climate resilience in sub-Saharan Africa [16,17]. Agroecology, grounded in ecological principles, aims to optimize nutrient cycling, increase beneficial biological interactions, and strengthen ecosystem resilience while simultaneously improving agricultural productivity and rural well-being [18,19].
Agroecological practices such as agroforestry, intercropping, mulching, composting, and soil- and water-conservation techniques have been associated with multiple co-benefits, including improved soil fertility, restoration of degraded land, increased biodiversity, and greater resilience to climate shocks . For instance, agroforestry systems have been shown to reduce erosion, increase soil organic carbon, and stabilize yields in highland agroecosystems [22,23]. Soil conservation practices such as mulching, composting and minimum tillage contribute to improving soil moisture retention and nutrient availability, which are crucial under increasingly irregular rainfall patterns [24].
Despite the growing interest in sustainable agriculture and agroecological transitions in sub-Saharan Africa, few studies conducted in the Democratic Republic of Congo (DRC), and particularly in mountainous regions such as South Kivu, have examined simultaneously the dimensions needed to understand agricultural sustainability dynamics. Previous work has documented the agroecological practices adopted by farmers, farm diversity through typologies, and the socioeconomic factors associated with adoption decisions or with membership of farm profiles [25,26]. In South Kivu, existing typologies have focused on a single commodity, such as the maize-farmer typology of [27], or on land degradation, such as the farm characterization of [8]. However, no study in the South Kivu highlands has jointly (i) built a household typology from a broad set of sixteen sustainable soil and crop management practices, (ii) identified how these practices are co-adopted, (iii) analyzed the factors associated with type membership, and (iv) compared the level of agroecological integration and the adoption constraints reported by each type. Providing this integrated perspective for the Equatorial High-Altitude Zone is the main contribution of the present study.
This limited integration weakens the ability of policymakers and development actors to design interventions aligned with the diversity of farming households [28]. Without a nuanced understanding of production-system diversity, the socioeconomic and technical factors associated with each group, and the barriers that hinder innovation uptake, spatially differentiated agricultural policies are difficult to formulate [26,28]. A contextualized, multidimensional understanding is therefore important for guiding agricultural strategies that respond to food insecurity, land degradation, and climate pressure in South Kivu. Developing an agroecological typology is useful because farming systems in South Kivu are heterogeneous and households adopt practices selectively. A typology captures this diversity, identifies coherent groups of production systems, and provides an analytical basis for interpreting adoption patterns and designing context-specific interventions. Responding to these gaps, the present study aims to provide an empirically grounded analysis of agroecological practices and farming-system diversity in the Equatorial High-Altitude Zone of South Kivu. By integrating household-level data, multivariate statistical techniques, and socioeconomic assessment, the study examines farming strategies, factors associated with typology membership, and constraints associated with transitions toward more sustainable agricultural systems. More specifically, the study aims to: (1) characterize agroecological-practice adoption and production systems; (2) analyze socioeconomic and technical factors associated with agroecological typology membership; and (3) identify and compare the constraints to practice adoption reported by each farmer type.
2. Materials and methods
2.1. Study area
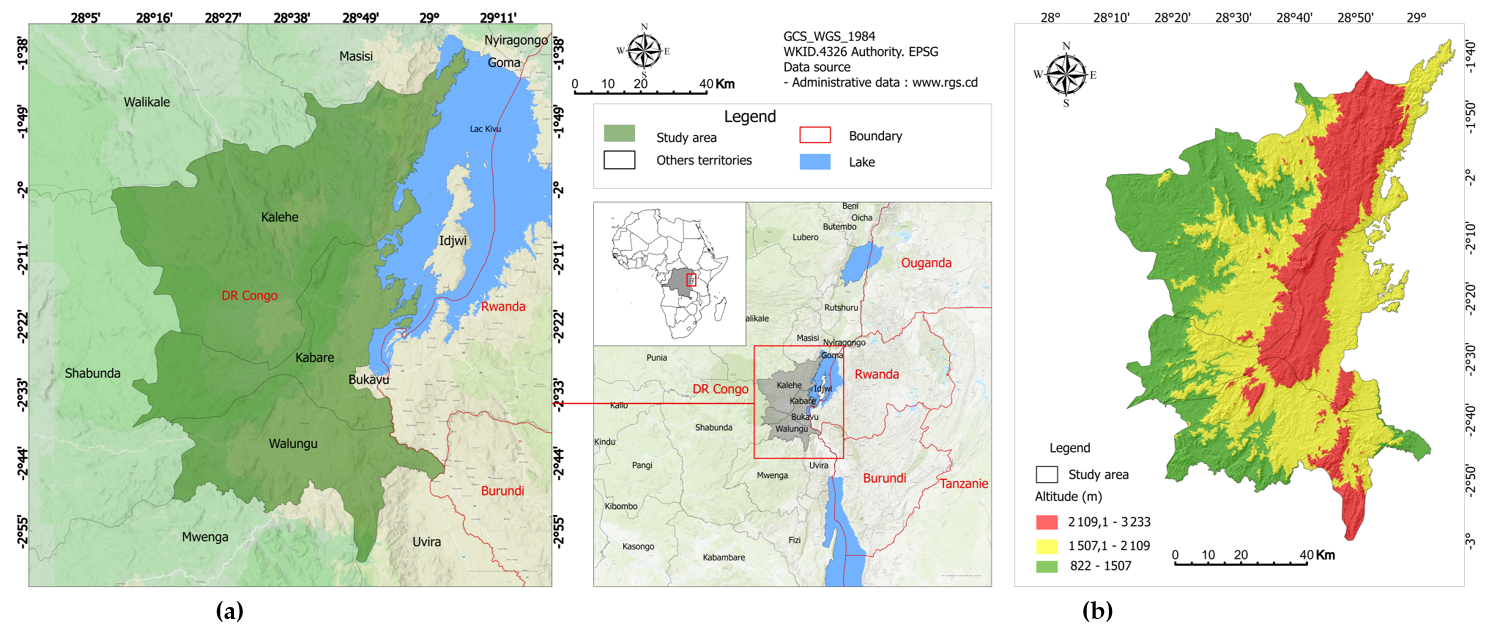
This study was conducted in the high-altitude portions of Kalehe, Kabare, and Walungu territories in South Kivu Province, eastern DRC (Figure 1). Within the recent province-wide agroecological zoning framework, the surveyed highland landscape is contextualized within the Equatorial High-Altitude Zone (EHAZ), one of six agroecological zones delineated from climatic, topographic, and edaphic information rather than elevation alone [29]. In this name, “equatorial” refers to the position of the zone close to the equator (about 2–3° S), which gives a bimodal rainfall regime with two cropping seasons per year (season A, September–January; season B, February–June), and “high-altitude” refers to the montane belt above Lake Kivu, where elevation keeps mean annual temperature around 20 °C. In this manuscript, EHAZ is used only as a geographical label for the agroecological zone in which all 374 surveyed households are located; it is not a variable in the analyses, and households were not further classified by altitude class. Kalehe represents the northern highland sector of the present study, whereas Kabare and Walungu represent central and southern highland sectors around the agricultural hinterland of Bukavu [26,30]. This framing is important because elevation and thermal regime are strongly coupled in mountainous South Kivu; consequently, elevation is interpreted as part of a broader agroecological context rather than as an isolated zoning criterion.
The EHAZ is characterized by a wet sub-humid tropical mountain environment and strong topographic gradients. Across the zone, elevation spans approximately 1,078-3,412 m, mean annual rainfall is about 1,672 mm, mean annual temperature is about 20.0 °C, and the length of the growing period is about 210 days [29]. The elevation range shown in Figure 1b (822-3,233m) covers the whole area of the three territories, whereas the survey was restricted to their high-altitude portions; the sampled households were located between 1,510and 1,800 m a.s.l. Elevation was derived from the ALOS PALSAR radiometric terrain-corrected (RTC) digital elevation model at 12.5 m spatial resolution[31]. At the local scale, the study landscape includes steep hills, deeply incised valleys, and plateaus, generating marked microclimatic and erosion gradients within the same broad agroecological zone [6].
In Kalehe and Kabare, volcanic parent materials support relatively fertile soils that are nevertheless highly vulnerable to erosion on steep slopes under intense rainfall [30]. Walungu is dominated by strongly weathered soils, including ferralsols, that are often acidic and degraded after prolonged cultivation, limited fallowing, and recurrent nutrient mining [8]. These local edaphic contrasts, superimposed on the shared EHAZ climate and relief context, justify analysis of household-level variation in agroecological practice adoption.
2.2. Methods
2.2.1. Data collection
The study involved 374 agricultural households from the high-altitude portions of Kalehe, Kabare, and Walungu. Data was collected between 25 February and 22 May 2025, and adoption refers to cropping season B of 2025. The sample size was calculated with Cochran’s formula, n = z²p(1 − p)/e², using z = 1.96 (95% confidence level), p = 0.5 (the value that maximizes the variance of a proportion and therefore gives the most conservative sample size) and a margin of error e = 0.05, which gives a target sample of n = (1.96² × 0.5 × 0.5)/0.05² = 384 households. Because the number of farming households in the surveyed areas is large relative to the sample, no finite-population correction was applied. Of the 384 questionnaires administered, 10 (2.6%) were incomplete or internally inconsistent and were excluded during data cleaning, leaving 374 valid questionnaires (97.4% of the target). With n = 374, the achieved margin of error is e = 1.96 × √(0.25/374) = 0.0507, i.e. ±5.1% at the 95% confidence level, which remains very close to the planned precision. Stratification was based on administrative and agroecological zones across the three territories; the sample was allocated to the strata in proportion to the number of farming households in the high-altitude part of each territory, resulting in a final sample distributed as follows: Kalehe (n = 99; 26.5%), Kabare (n = 132; 35.3%) and Walungu (n = 143; 38.2%). The survey covered 15 main villages selected purposively for their location in the high-altitude zone, the importance of agriculture and accessibility: Cibanja, Ishovu, Munanira and Muhongoza in the Buhavu chiefdom (Kalehe); Lwiro and Buloli in the Kabare chiefdom (Kabare); and Ibanda, Munya, Nyakazenga, Bideka, Nyangezi, Chirangaza, Luchiga, Ciherano and Mugogo in the Ngweshe chiefdom (Walungu). These villages accounted for 349 households (93.3%), the remaining 25 households (6.7%) were surveyed in neighbouring villages of the same chiefdoms. Within each village, households were selected using systematic random sampling from local administrative rosters. The respondent was the household head (37.7%) or the spouse (62.3%). The questionnaire was pre-tested with 10 households in a non-sampled village, and 10 enumerators were trained for 7 days before data collection. Data collection was conducted using a digital questionnaire administered through KoboCollect, enabling direct entry and programmed quality checks. The questionnaire covered socioeconomic characteristics, access to resources, agroecological practices, harvest management, and adoption constraints, consistent with literature showing that innovation adoption depends on structural conditions such as access to land and labor as well as technical availability [32].
Practice was considered adopted when the household reported using it on at least one plot during the reference season (1 = adopted, 0 = not adopted). The sixteen (16) practices were: minimum tillage (hoe tillage limited to planting holes or lines); contour farming (ridges, hedgerows or cultivation along contour lines); mulching (soil covered with residues or cut biomass); composting (farm-made compost from residues and manure); green manure (plants grown for incorporation as a nutrient source); cover crops (crops grown mainly to protect the soil); crop rotation (alternation of crops on the same plot across seasons); intercropping (two or more simultaneous crops on the same plot); organic amendments (organic inputs other than farm compost); mineral fertilizers (synthetic fertilizers); residue incorporation (crop residues worked into the soil); runoff-water harvesting (structures collecting runoff for crops); efficient irrigation (water-saving supplementary watering, e.g. targeted watering-can or small drip systems); agroforestry (trees or shrubs maintained on or around plots); local varieties (locally adapted landraces); and biopesticides (botanical or biological pest control). Although mineral fertilizers are not agroecological in the strict sense, they were retained as part of integrated soil-fertility management, so the set is referred to as sustainable soil and crop management practices.
For each of the sixteen practices, households were asked which constraints limited its adoption (multiple responses allowed). A household was considered to face a constraint when it reported it for at least one practice. Constraint categories were lack of resources (cash, inputs or labor), lack of information (insufficient knowledge or training), high workload, land ownership (insecure tenure or non-ownership), terrain not applicable (e.g. slope or soil unsuitable) and “Don’t like it” (lack of interest or preference against the practice).
2.2.2. Data analysis
Data were exported in CSV format and processed in R (version 4.5.2). Village names and categorical values were harmonized (spelling variants and trailing spaces) and missing values were checked for each variable; none of the variables used in the analyses had missing values, so that all analyses used the full sample of n = 374 households. Adoption indicators were standardized for the PCA [33]. Age and farming experience were recorded in three classes and entered as categorical variables in the MNLR, together with the other categorical predictors [33,34]. Analyses used the R packages FactoMineR 2.16, cluster 2.1.8.2, fpc 2.2.14, mclust 6.1.2, nnet 7.3.20, brglm2 1.1.1, car 3.1.5 and ggplot2 4.0.2.
The agroecological typology was constructed from sixteen binary (0/1) adoption indicators: minimum tillage, contour farming, mulching, composting, green manure, cover crops, crop rotation, intercropping, organic amendments, mineral fertilizers, residue incorporation, runoff-water harvesting, efficient irrigation, agroforestry, local varieties, and biopesticides. A standardized PCA of these indicators was performed, and the scores of the first five principal components (55.5% of the variance) served as the basis for hierarchical clustering using Ward’s minimum variance method [35]. The number of clusters was chosen from the loss of between-cluster inertia. Merging four clusters into three would have lost 11.1% of the total inertia, whereas merging five clusters into four lost only 5.0%; the four-cluster solution was also the most interpretable agronomically. The quality of the four-cluster partition was assessed with the average silhouette width (0.30; 0.39, 0.24, 0.47 and 0.26 for Types 1–4), which was similar to or higher than that of the three- to six-cluster solutions (0.27–0.30) (Rousseeuw, 1987). Its stability was assessed with a bootstrap of the whole PCA–clustering procedure (fpc::clusterboot, 100 resamples). The mean Jaccard similarity per cluster ranged from 0.92 to 1.00, indicating highly stable clusters [33]. K-means partitioning, initialized with the centroids of the Ward clusters, was then applied to consolidate household groups into the final four-cluster solution (k = 4); during this consolidation step, 34 households (9.1%) changed cluster. The robustness of the typology to the use of PCA on binary indicators was checked by Ward clustering on the square root of the Jaccard distance computed directly from the binary indicators[35]. Agreement with the retained typology was measured with the adjusted Rand index [36]ARI = 0.70, or 0.74 when only the sixteen practices were used; Type 3 was recovered identically. The sixteen practices were then grouped into co-adoption families by hierarchical clustering (Euclidean distance, Ward.D2 linkage) of their adoption profiles across the four farmer types (column dendrogram of Figure 3a), and the practice tree was cut into four families at the level where the fusion height increased most markedly.
To identify factors associated with household membership in each agroecological type, a multinomial logistic regression (MNLR) was fitted with Type 1 as the reference category (Hosmer et al., 2013; Agresti, 2013). Explanatory variables covered socioeconomic attributes and technical and land-related factors selected from determinants recognized in the innovation literature [14]; their definitions, coding and descriptive statistics by type are given in Table S1. Territory was dummy-coded with Kalehe as the reference category. To keep the model parsimonious given the small size of Type 3 (n = 42), sparse categories were merged and the following predictors were used: age (< 35, 35–50, > 50 years), farming experience (≤ 10, 11–30, > 30 years), gender, formal education (yes/no), hired labor (yes/no), off-farm activity (trade or wage employment, yes/no), land position (valley, hillside, hilltop), land size (< 0.5 ha vs ≥ 0.5 ha), rented land (yes/no) and perceived soil fertility (low or medium vs good or very good), i.e. 15 parameters per equation. Cross-tabulations of each predictor by type were inspected, and multicollinearity was assessed with generalized variance inflation factors (GVIF; Fox & Monette, 1992); all GVIF1/(2·df) values were ≤ 1.42. Variables that describe the farming system itself (land use, crops grown and share of the harvest sold) were not used as predictors because they are components or outcomes of the system rather than prior determinants of type membership. Only one Kalehe household belonged to Type 2 and one to Type 4, which caused quasi-complete separation in the maximum-likelihood fit (|β| up to 7.6); the model was therefore estimated by bias-reducing penalized likelihood [37], as implemented for multinomial models in the brglm2 package[38]. For each contrast, we report β, its standard error, the odds ratio (OR) with 95% confidence interval and the p-value, together with the number of observations, the likelihood-ratio χ² test against the null model, McFadden's pseudo-R² and the AIC. Associations between territories or typological groups and categorical adoption/constraint variables were evaluated using Pearson's χ² test when expected cell counts met standard assumptions (Eij ≥ 5), and Fisher's exact test was applied otherwise [39]. To account for multiple testing, p-values were adjusted with [40] method within each family of tests (16 practice tests in Table 1; six constraint tests in Table 3).
2.2.3. Uncertainty estimation
For the MNLR, 95% confidence intervals of the odds ratios were obtained by exponentiating Wald intervals computed on the log-odds scale from the penalized-likelihood standard errors (Table 2). For proportions (Table 3), 95% confidence intervals were computed with the Wilson score method [41].
3. Results
3.1. Characterization of the adoption of agroecological practices and production systems
Table 1 synthesizes farmers’ adoption of agroecological practices and reveals strong spatial disparities among Kalehe, Kabare, and Walungu, indicating a strong association between territorial context and practice adoption.
| Agroecological practice | Kalehe (n = 99) | Kabare (n = 132) | Walungu (n = 143) | Overall (n = 374) | χ² (df = 2) | p | pHolm |
|---|---|---|---|---|---|---|---|
| Minimum tillage | 97.0 | 49.2 | 67.8 | 69.0 | 60.4 | < 0.001 | < 0.001 *** |
| Contour farming | 91.9 | 43.2 | 45.5 | 57.0 | 67.3 | < 0.001 | < 0.001 *** |
| Mulching | 85.9 | 68.2 | 62.9 | 70.9 | 15.6 | < 0.001 | 0.002 ** |
| Composting | 64.6 | 95.5 | 81.8 | 82.1 | 36.5 | < 0.001 | < 0.001 *** |
| Green manure | 4.0 | 15.2 | 37.8 | 20.9 | 44.3 | < 0.001 | < 0.001 *** |
| Cover crops | 78.8 | 57.6 | 67.1 | 66.8 | 11.5 | 0.003 | 0.016 * |
| Crop rotation | 97.0 | 75.8 | 95.8 | 89.0 | 36.9 | < 0.001 | < 0.001 *** |
| Intercropping | 99.0 | 81.8 | 95.1 | 91.4 | 25.3 | < 0.001 | < 0.001 *** |
| Organic amendments | 12.1 | 11.4 | 18.2 | 14.2 | 3.1 | 0.213 | 0.421 ns |
| Mineral fertilizers | 2.0 | 10.6 | 21.0 | 12.3 | 20.0 | < 0.001 | < 0.001 *** |
| Residue incorporation | 44.4 | 47.7 | 60.1 | 51.6 | 7.0 | 0.030 | 0.121 ns |
| Runoff-water harvesting | 6.1 | 27.3 | 18.2 | 18.2 | 17.1 | < 0.001 | 0.001 ** |
| Efficient irrigation | 13.1 | 15.2 | 8.4 | 12.0 | 3.1 | 0.210 | 0.421 ns |
| Agroforestry | 98.0 | 75.0 | 41.3 | 68.2 | 91.1 | < 0.001 | < 0.001 *** |
| Local varieties | 100.0 | 96.2 | 96.5 | 97.3 | Fisher | 0.125 | 0.375 ns |
| Biopesticides | 29.3 | 10.6 | 32.2 | 23.8 | 19.8 | < 0.001 | < 0.001 *** |
Values are percentages of households adopting each practice. pHolm: p-value adjusted for 16 comparisons with Holm's method; significance codes (based on pHolm): *** p < 0.001; ** p < 0.01; * p < 0.05; ns p ≥ 0.05. Pearson's χ² test was performed when expected cell counts met standard assumptions (Eᵢⱼ ≥ 5); Fisher's exact test was applied when expected counts were lower than 5 (Eᵢⱼ < 5).
Despite the widespread dissemination of several practices, their territorial uptake remains highly variable. Traditional practices such as intercropping, crop rotation, and the use of local varieties exhibit very high adoption rates, exceeding 75% across all territories. Among these, only local varieties (adopted at rates ranging from 96.2% to 100%) show no statistically significant differences between territories (p = 0.125, pHolm = 0.375), given near-universal adoption, this most likely reflects a ceiling effect. In contrast, intercropping (χ² = 25.3, p < 0.001) and crop rotation (χ² = 36.9, p < 0.001) display highly significant territorial differences.
Several practices differ markedly between territories. Minimum tillage shows an extremely pronounced difference between territories (χ² = 60.4, p < 0.001), with markedly higher adoption in Kalehe (97.0%). Similarly, contour farming reveals a notable disparity (χ² = 67.3, p < 0.001). Mulching also differs significantly (χ² = 15.6, p < 0.001), with adoption rates reaching 85.9% in Kalehe compared with 62.9% in Walungu. Other practices exhibit more localized adoption patterns. Composting displays a highly significant territorial difference (χ² = 36.5, p < 0.001), with particularly high uptake in Kabare (95.5%). Green manuring, although weakly adopted overall (4.0% in Kalehe, 15.2% in Kabare, and 37.8% in Walungu), shows very strong statistical significance (χ² = 44.3, p < 0.001), indicating spatial structuring despite its emerging status. Cover cropping also demonstrates uneven adoption (χ² = 11.5, p = 0.003), with proportions of 78.8% in Kalehe, 57.6% in Kabare, and 67.1% in Walungu.
Conversely, some practices remain marginal and homogeneous across territories. Organic amendments and efficient irrigation show low adoption rates, around 13%, and do not exhibit significant differences (p = 0.213 for organic amendments and p = 0.210 for efficient irrigation), indicating limited and weakly structured diffusion throughout the study area. Agroforestry, however, stands out as one of the most striking results (χ² = 91.1, p < 0.001). Adoption rates of 98.0% in Kalehe, 75.0% in Kabare, and 41.3% in Walungu reveal very pronounced territorial differentiation. Mineral fertilizers were rarely used (2.0–21.0%) but differed significantly between territories (χ² = 20.0, p < 0.001), as did runoff-water harvesting (6.1–27.3%; χ² = 17.1, p < 0.001). Finally, the use of biopesticides, an emerging practice, shows modest adoption rates (29.3% in Kalehe, 10.6% in Kabare, and 32.2% in Walungu) yet differs significantly across territories (χ² = 19.8, p < 0.001). Residue incorporation differed at the 5% level (χ² = 7.0, p = 0.030), but not after Holm adjustment (pHolm = 0.121); all other significant differences remained significant after adjustment.
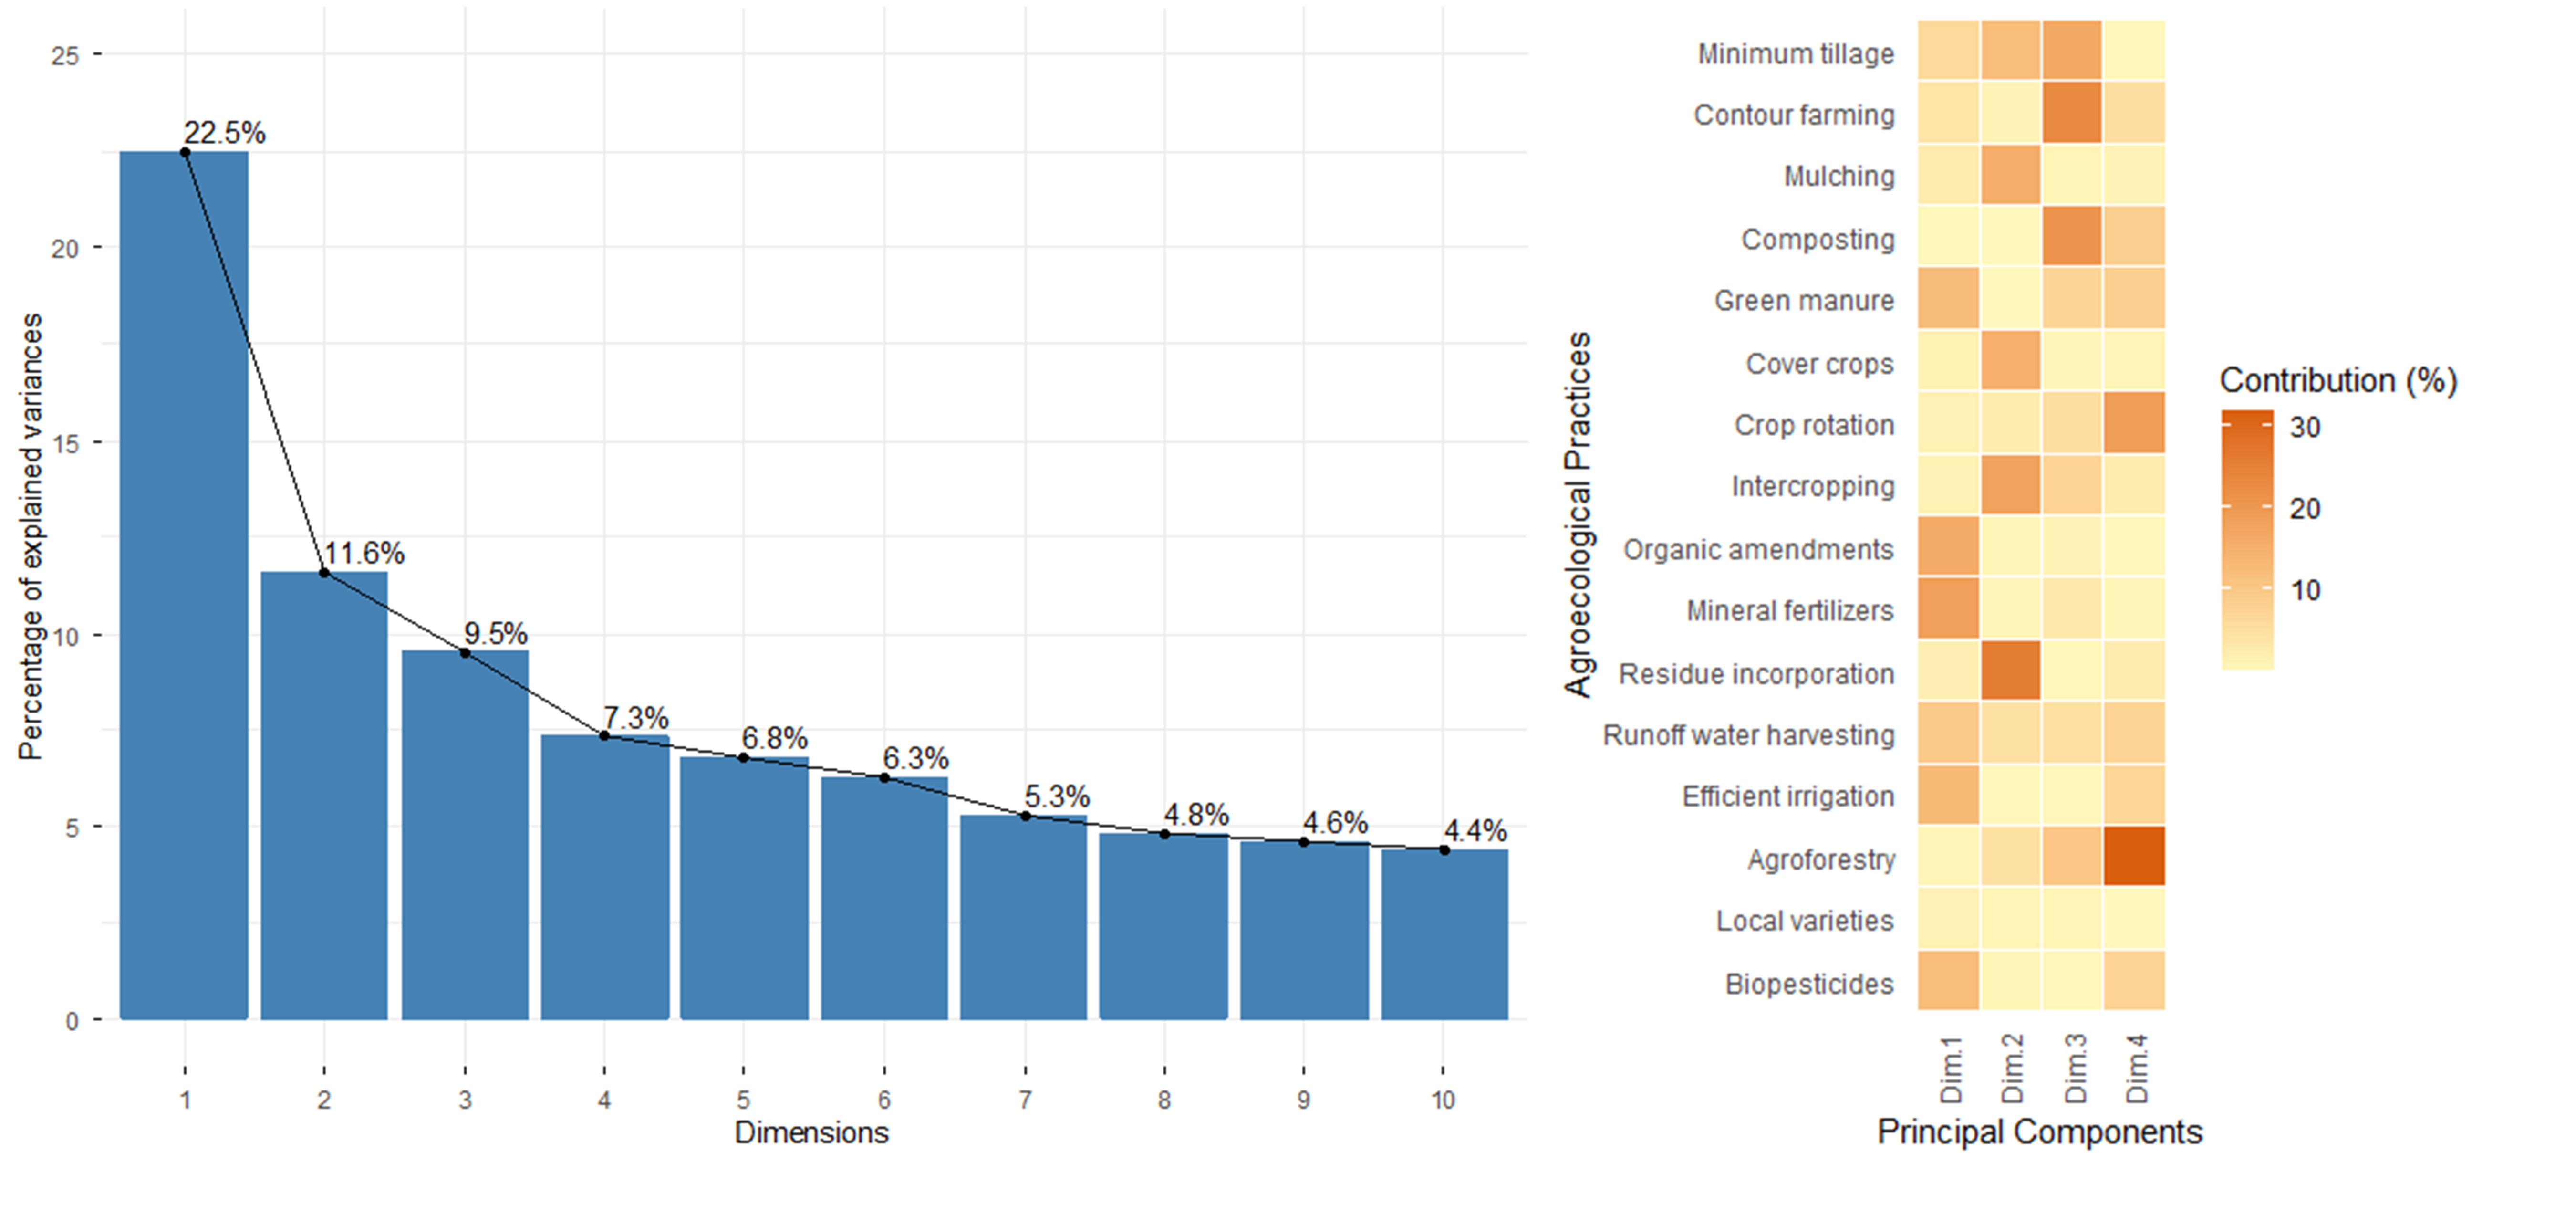
This marked heterogeneity in practice adoption is further clarified by the multivariate structure revealed in Table 2. The Kaiser–Meyer–Olkin measure indicated adequate sampling (KMO = 0.74), and Bartlett's test of sphericity confirmed significant inter-variable correlation (χ² = 1273.8, df = 120, p < 0.001). The PCA provides a synthetic statistical representation of these territorial disparities by identifying the major axes along which farming systems diverge. The scree plot (Figure 2a) shows that the first three components capture 43.6% of the variance and that six components have eigenvalues > 1 (3.60, 1.85, 1.52, 1.17, 1.09 and 1.00; after rounding 64.0% of the variance); these six components were retained for clustering. The contribution plot (Figure 2b) indicates that the first principal component reflects the use of external-input and resource-intensive practices (mineral fertilizers, organic amendments, efficient irrigation, green manure, biopesticides, runoff-water harvesting), while the second axis captures residue incorporation, intercropping, mulching and cover cropping. The third component is associated with contour farming, composting and minimum tillage, and the fourth with agroforestry and crop rotation.
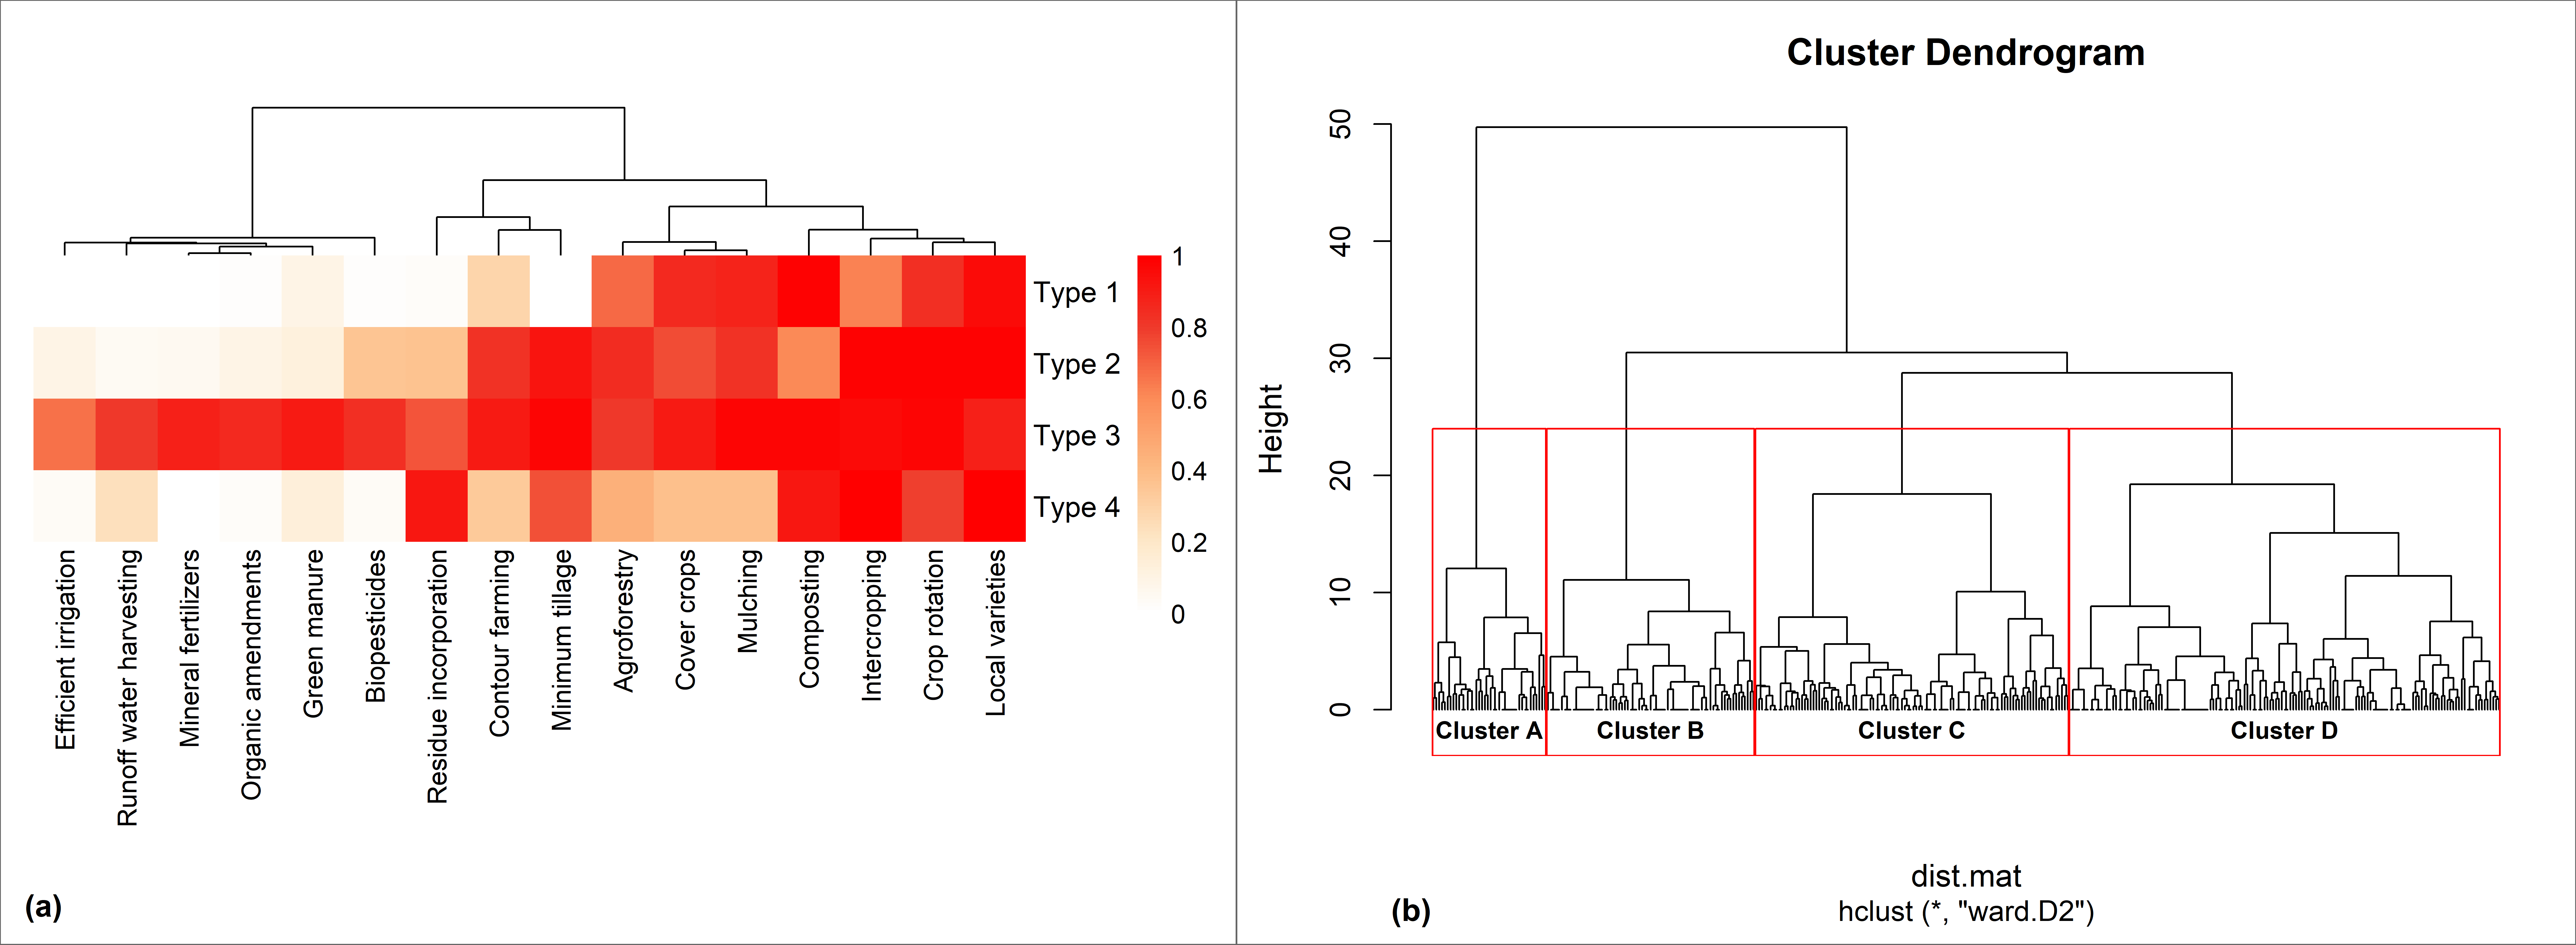
To prevent ambiguity between farm profiles and practice groupings, Figure 3 combines two distinct yet complementary levels of analysis: the heatmap (Figure 3a) shows the proportion of households adopting each practice in the four farmer types, and its column dendrogram groups the sixteen practices into four co-adoption families (A-D) according to their adoption profiles, whereas the dendrogram of Figure 3b shows the hierarchical clustering of the 374 households from which the farmer types were derived.
Four farmer types emerge from the clustering (Figure 3a). Type 1, conservation-oriented systems (n = 74; 19.8%), shows high adoption of physical soil-conservation and ecological-regulation practices (minimum tillage, contour farming, agroforestry, mulching and cover crops) together with the foundational practices (intercropping, crop rotation and local varieties), but low adoption of the practices that require external inputs or investment (mineral fertilizers, organic amendments, efficient irrigation, green manure, runoff-water harvesting and biopesticides). Type 2, soil-fertility systems (n = 138; 36.9%), is the largest group; it is characterized by high adoption of composting, residue incorporation and minimum tillage, moderate adoption of contour farming, agroforestry, mulching and cover crops, and low adoption of external-input practices. Type 3, integrated systems (n = 42; 11.2%), shows high adoption of almost sixteen practices, including the resource-intensive practices that are rare in the other types. Type 4, soil-cover systems (n = 120; 32.1%), combines high adoption of composting, mulching, cover crops, crop rotation and local varieties with very low adoption of minimum tillage, residue incorporation, contour farming and external-input practices. Kalehe households were found almost exclusively in Types 1 and 3 (only one Kalehe household in each of Types 2 and 4), so the typology partly reflects territorial differences; accordingly, the Type 1 profile is close to the Kalehe column of Table 1.
The column dendrogram of Figure 3a groups the practices themselves into four functional families based on their adoption patterns. Family A (resource-intensive practices) groups efficient irrigation, organic amendments, mineral fertilizers, biopesticides, green manure, and runoff-water harvesting. Family B (physical soil-management practices) aggregates residue incorporation, minimum tillage, and contour farming. Family C (ecological-regulation practices) combines agroforestry, mulching, and cover crops. Lastly, Family D (foundational practices) includes composting, intercropping, crop rotation, and local varieties, which represent widely adopted baseline techniques across the study area. The families describe which practices tend to be adopted together and complement the household-level typology.
3.2. Factors associated with household membership in typological groups
Table 2 presents the bias-reduced (penalized) multinomial logistic regression for Types 2, 3, and 4 relative to Type 1. The model was based on all 374 households and was globally significant (likelihood-ratio χ² = 541.6, df = 45, p < 0.001; McFadden pseudo-R² = 0.549; AIC = 541.1).
| Variable (reference category) | β (SE) | Type 2 vs Type 1 OR [95% CI] | p | β (SE) | Type 3 vs Type 1 OR [95% CI] | p | β (SE) | Type 4 vs Type 1 OR [95% CI] | p |
|---|---|---|---|---|---|---|---|---|---|
| Intercept | 0.03 (1.41) | – | 0.981 | −4.80 (1.35) | – | < 0.001 *** | −5.60 (1.41) | – | < 0.001 *** |
| Territory: Kabare (Kalehe) | 2.69 (1.04) | 14.69 [1.91–112.90] | 0.010 ** | 3.96 (0.90) | 52.55 [9.08–304.15] | < 0.001 *** | 6.46 (1.05) | 638.52 [81.80–4984.25] | < 0.001 *** |
| Territory: Walungu (Kalehe) | 3.43 (1.01) | 30.86 [4.25–224.32] | < 0.001 *** | 2.48 (0.80) | 11.97 [2.51–57.11] | 0.002 ** | 5.88 (1.08) | 358.38 [43.15–2976.19] | < 0.001 *** |
| Age: 35–50 years (< 35 years) | −0.04 (0.60) | 0.96 [0.29–3.14] | 0.948 | −0.55 (0.60) | 0.58 [0.18–1.87] | 0.360 | −0.07 (0.61) | 0.93 [0.28–3.09] | 0.911 |
| Age: > 50 years (< 35 years) | −1.20 (0.87) | 0.30 [0.05–1.66] | 0.168 | −0.74 (0.92) | 0.48 [0.08–2.88] | 0.420 | −0.73 (0.88) | 0.48 [0.09–2.71] | 0.406 |
| Farming experience: 11–30 years (≤ 10 years) | 0.71 (0.73) | 2.03 [0.48–8.53] | 0.336 | 0.05 (0.61) | 1.05 [0.32–3.46] | 0.934 | 0.14 (0.64) | 1.15 [0.33–4.00] | 0.827 |
| Farming experience: > 30 years (≤ 10 years) | 1.01 (1.03) | 2.74 [0.36–20.57] | 0.327 | −0.28 (1.02) | 0.75 [0.10–5.52] | 0.782 | 0.47 (0.97) | 1.59 [0.24–10.66] | 0.631 |
| Gender: female (male) | 0.37 (0.45) | 1.45 [0.60–3.53] | 0.412 | 0.35 (0.46) | 1.41 [0.58–3.47] | 0.451 | 0.51 (0.48) | 1.66 [0.65–4.24] | 0.286 |
| Formal education: yes (no) | 0.14 (0.48) | 1.16 [0.45–2.96] | 0.763 | 1.06 (0.56) | 2.87 [0.97–8.54] | 0.057 | 1.11 (0.54) | 3.03 [1.05–8.77] | 0.041 * |
| Hired labor: yes (no) | −1.12 (0.55) | 0.33 [0.11–0.95] | 0.040 * | 0.72 (0.53) | 2.06 [0.73–5.83] | 0.175 | 0.23 (0.57) | 1.25 [0.41–3.86] | 0.692 |
| Off-farm activity: yes (no) | −0.18 (0.46) | 0.83 [0.34–2.07] | 0.696 | 0.58 (0.53) | 1.78 [0.63–5.07] | 0.277 | 0.14 (0.52) | 1.16 [0.42–3.18] | 0.779 |
| Land position: hillside (valley) | −1.13 (0.50) | 0.32 [0.12–0.86] | 0.023 * | −1.62 (0.54) | 0.20 [0.07–0.57] | 0.003 ** | −2.52 (0.57) | 0.08 [0.03–0.25] | < 0.001 *** |
| Land position: hilltop (valley) | −0.81 (0.86) | 0.45 [0.08–2.38] | 0.345 | −1.06 (0.80) | 0.35 [0.07–1.68] | 0.188 | −1.17 (0.72) | 0.31 [0.08–1.28] | 0.106 |
| Land size: ≥ 0.5 ha (< 0.5 ha) | −3.39 (0.66) | 0.03 [0.01–0.12] | < 0.001 *** | 1.12 (0.71) | 3.07 [0.76–12.40] | 0.115 | 1.53 (0.69) | 4.61 [1.19–17.81] | 0.027 * |
| Rented land: yes (no) | 0.59 (0.60) | 1.80 [0.55–5.85] | 0.329 | −1.25 (0.68) | 0.29 [0.08–1.07] | 0.064 | 0.18 (0.61) | 1.20 [0.36–3.98] | 0.769 |
| Perceived soil fertility: good or very good (low or medium) | −0.69 (0.61) | 0.50 [0.15–1.68] | 0.264 | 1.61 (0.68) | 5.01 [1.32–18.99] | 0.018 * | −1.33 (0.62) | 0.27 [0.08–0.90] | 0.033 * |
| Model fit: n = 374; likelihood-ratio χ² = 541.6 (df = 45), p < 0.001; McFadden pseudo-R² = 0.549; AIC = 541.1 | |||||||||
β: coefficient (log-odds scale) of the bias-reduced (Firth-type) multinomial logit model; SE: standard error; OR: odds ratio; CI: confidence interval. Type 1 is the reference category; reference levels of categorical predictors are given in parentheses. The very large and imprecise odds ratios for territory in Type 4 reflect the near absence of Kalehe households in this type (one household, likewise in Type 2). Land use, crops grown and share of the harvest sold were not included as predictors (see Section 2.2.2). Significance thresholds: ***p < 0.001; **p < 0.01; *p < 0.05.
The bias-reduced MNLR shows that household membership in Types 2, 3, and 4 is mostly associated with a combination of territorial and farm-structural characteristics, with associations that differ among types. Relative to Kalehe, households from Kabare and Walungu were much more likely to belong to Types 2, 3 and 4 than to Type 1 (Table 2). Holding territory constant, households farming on hillsides rather than in valleys were less likely to belong to Type 2 (OR = 0.32, 95% CI 0.12–0.86), Type 3 (OR = 0.20, 0.07–0.57) and Type 4 (OR = 0.08, 0.03–0.25). For Type 2, farms of at least 0.5 ha (OR = 0.03, 0.01–0.12) and households using hired labor (OR = 0.33, 0.11–0.95) were less likely to belong to this class, implying that Type 2 is mainly associated with small plots and family labor. For Type 3, perceived soil fertility was positively associated with membership (OR = 5.01, 1.32–18.99). For Type 4, farms of at least 0.5 ha (OR = 4.61, 1.19–17.81) and households with formal education (OR = 3.03, 1.05–8.77) were more likely, and households perceiving their soil as fertile less likely (OR = 0.27, 0.08–0.90), to belong to this type. Age, gender, farming experience, off-farm activity and land renting were not significantly associated with membership of any type, and formal education was associated only with Type 4. Because the data are cross-sectional, these results describe associations and not causal effects.
3.3. Constraints to agroecological practice adoption across farmer types
Table 3 compares the constraints to agroecological practice adoption reported by the four farmer types.
| Constraint | Type 1 (n = 74) | Type 2 (n = 138) | Type 3 (n = 42) | Type 4 (n = 120) | Overall (n = 374) | χ² (df = 3) | pHolm |
|---|---|---|---|---|---|---|---|
| Lack of resources | 97.3 (72) [90.7–99.3] | 71.7 (99) [63.7–78.6] | 50.0 (21) [35.5–64.5] | 88.3 (106) [81.4–92.9] | 79.7 (298) [75.3–83.4] | 48.0 | < 0.001 *** |
| Lack of information | 97.3 (72) [90.7–99.3] | 85.5 (118) [78.7–90.4] | 47.6 (20) [33.4–62.3] | 31.7 (38) [24.0–40.4] | 66.3 (248) [61.4–70.9] | 125.6 | < 0.001 *** |
| High workload | 6.8 (5) [2.9–14.9] | 68.1 (94) [59.9–75.3] | 4.8 (2) [1.3–15.8] | 40.8 (49) [32.5–49.8] | 40.1 (150) [35.3–45.2] | 101.2 | < 0.001 *** |
| Land ownership | 16.2 (12) [9.5–26.2] | 5.1 (7) [2.5–10.1] | 2.4 (1) [0.4–12.3] | 21.7 (26) [15.2–29.9] | 12.3 (46) [9.3–16.0] | 21.3 | < 0.001 *** |
| Terrain not applicable | 1.4 (1) [0.2–7.3] | 6.5 (9) [3.5–11.9] | 2.4 (1) [0.4–12.3] | 2.5 (3) [0.9–7.1] | 3.7 (14) [2.2–6.2] | Fisher | 0.246 ns |
| Don't like it | 71.6 (53) [60.5–80.6] | 21.7 (30) [15.7–29.3] | 26.2 (11) [15.3–41.1] | 85.0 (102) [77.5–90.3] | 52.4 (196) [47.3–57.4] | 125.7 | < 0.001 *** |
Values are percentages of households in each type reporting the constraint for at least one of the sixteen practices (multiple responses allowed); numbers of households in parentheses and 95% Wilson confidence intervals in square brackets. Constraint categories are defined in Section 2.2.1. Pearson's χ² test was used when expected-count assumptions were met, and Fisher's exact test otherwise; pHolm: p-value adjusted for six comparisons with Holm's method. Significance codes: *** p < 0.001; ** p < 0.01; * p < 0.05.
The results reveal statistically significant heterogeneity among types for five of the six constraints (pHolm < 0.001). Lack of resources was most frequent in Type 1 (97.3%) and Type 4 (88.3%), lack of information in Type 1 (97.3%) and Type 2 (85.5%), and high workload in Type 2 (68.1%). Type 3 reported the lowest frequencies of lack of resources (50.0%), high workload (4.8%) and land-ownership constraints (2.4%), whereas lack of information was least frequent in Type 4 (31.7%). Lack of interest in the practices (“Don’t like it”) was reported by 85.0% of Type 4 and 71.6% of Type 1 households, and land ownership was mainly reported in Type 4 (21.7%) and Type 1 (16.2%). Only the constraint related to non-applicability of the land remains low (1.4–6.5%) across groups and does not differ significantly among types (pHolm = 0.246). These findings show that the constraints to adoption differ markedly among farmer types, which supports tailoring interventions to household profiles in the Equatorial High-Altitude Zone of South Kivu.
4. Discussion
4.1. Characterization of the adoption of agroecological practices and production systems
The marked differences in practice adoption among Kalehe, Kabare and Walungu (Table 1) indicate that agroecological transitions in these highlands are strongly associated with local biophysical and socio-economic conditions. Foundational practices (local varieties, intercropping and crop rotation) were adopted by more than 75% of households in all territories. The absence of a territorial difference for local varieties most likely reflects a ceiling effect and is consistent with the central role of landraces in low-input systems of eastern DRC [27].
Physical soil conservation was much more frequent in Kalehe (minimum tillage 97.0%, contour farming 91.9%) than in Kabare and Walungu. A plausible explanation is the steepness of the Kalehe slopes, where farmers protect their soils against erosion under intense rainfall [6,42]; this hypothesis could not be tested directly because slope was not measured at plot level. The lower adoption of mulching in Walungu may reflect biomass scarcity and competing uses of crop residues [43,44].
Composting was almost universal in Kabare (95.5%), where land fragmentation and proximity to Bukavu may encourage farmers to compensate for the absence of fallow with organic inputs. Agroforestry declined from 98.0% in Kalehe to 41.3% in Walungu; we hypothesize that differences in tree cover, land tenure and fuelwood demand contribute to this gradient [23,30], but these factors were not measured in the present study.
Practices requiring purchased inputs or investment (organic amendments, efficient irrigation) remained rare in all territories, which is consistent with the lack of resources reported by most households (Table 3). Mineral fertilizer use, although low, was highest in Walungu (21.0%); local input-supply programmes may explain this pattern, but this remains to be verified. Biopesticides and green manure showed moderate, spatially structured adoption, suggesting that their diffusion depends on local extension and on the availability of plant material [43].
The first three principal components explained 43.6% of the variance (64.0% for the six retained components), a modest but common share for heterogeneous household datasets [45,46]. The first component was associated with external-input and resource-intensive practices, the second with residue incorporation and soil cover, the third with physical soil protection and composting, and the fourth with agroforestry and crop rotation, indicating that tree-based management forms a distinct dimension of these highland farming systems.
Previous typologies in South Kivu were built around a single commodity [27] or around land degradation and farm characteristics [8], whereas the present typology is based directly on the combination of sixteen practices. It shows that households build differentiated practice packages by combining elements from several co-adoption families (Families A–D), as reported for agroecological typologies elsewhere in Africa [25,47]. However, Kalehe households were found almost only in Types 1 and 3, so part of the diversity captured by the typology is territorial; the types should therefore be interpreted as territory-related practice profiles rather than as fully independent farm strategies.
4.2. Factors associated with farmers' membership of agroecological types
The penalized MNLR indicated that membership of the agroecological types was associated mainly with territory and with farm-structural characteristics (land position, farm size, perceived soil fertility and use of hired labor), whereas age, gender, farming experience, off-farm activity and land renting were not, and formal education was associated only with Type 4. This pattern is consistent with adoption reviews showing that few determinants act universally and that farm structure, labor and location jointly shape adoption [14,48].
While demographic factors such as age, gender, and education may influence adoption indirectly, age and gender were not associated with type membership in our model, and formal education only with Type 4 (OR = 3.03); their effect therefore appears secondary to the structural characteristics of the farm and to territory. Households that can leverage technical knowledge, optimize labor deployment, and make strategic use of land resources may be more likely to engage in complex agroecological practices. This interpretation is consistent with the notion that agroecology is inherently a knowledge- and management-intensive system, where understanding ecological interactions and coordinating farm activities is critical [49,50]. Spatial context was also strongly associated with type membership: territory was the strongest correlate of membership, and hillside plots were associated with Type 1 rather than with Types 2–4, consistent with the high adoption of contour farming and minimum tillage in Type 1. Perceived soil fertility was positively associated with Type 3 and negatively with Type 4, but this association may run both ways, since practices such as composting and green manure can improve soil fertility. Households operating on more marginal or erosion-prone land may also face structural limitations that hinder adoption [48].
Secondary income activities were not significantly associated with type membership in the model, although households more heavily engaged in off-farm work may have less capacity to implement intensive agroecological practices [51]. These findings suggest the need for policies and extension strategies that prioritize technical support, resource optimization, and context-specific interventions. Efforts to promote agroecological adoption should move beyond simple targeting based on socio-demographic criteria and instead focus on enhancing farm management capacities, facilitating knowledge transfer, and addressing site-specific ecological constraints [32].
4.3. Constraints to agroecological practice adoption across farmer types
Constraints differed markedly among farmer types (Table 3), which is consistent with the view that agroecological transitions depend on farmers' resource endowments, knowledge and socio-technical environment [48,52]. Lack of resources (cash, inputs or labor) was the most frequent constraint overall (79.7%) and was reported by almost all Type 1 (97.3%) and most Type 4 (88.3%) households, which is consistent with the low adoption of practices requiring purchased inputs in these two types.
Lack of information was most frequent in Types 1 (97.3%) and 2 (85.5%), indicating a need for training on the practices that these types rarely use. Type 3 households reported the lowest frequencies of lack of resources, high workload and land-ownership constraints, which may help them to combine many practices, since agroecology is a knowledge- and management-intensive approach [53,54]. High workload was mainly reported in Type 2 (68.1%), whose composting- and residue-based practices require substantial manual labor.
Lack of interest in the practices (“Don’t like it”) was the most frequent constraint in Type 4 (85.0%) and the second most frequent in Type 1 (71.6%). This attitudinal dimension shows that adoption is not limited by structural factors alone: some practices may be perceived as poorly suited to farmers' objectives, too risky or too demanding. Participatory approaches that test practices with farmers and take their preferences into account are therefore needed alongside resource-oriented support [29,55].
4.4. Study limitations
This study has limitations. First, its cross-sectional design identifies associations, not causal effects, and does not capture changes in adoption over time. Second, adoption and constraints were self-reported as binary indicators for a single season, so implementation intensity and quality are not represented, and recall or social-desirability bias cannot be excluded. Third, standard PCA was applied to binary indicators as a descriptive dimension-reduction step; methods designed for binary data could yield somewhat different groupings. Fourth, Type 3 is small (n = 42), which limits the precision of its estimates, and type membership is partly confounded with territory, since Kalehe households were almost absent from Types 2 and 4. Fifth, no yield, income or labor-productivity data were analyzed, so the agronomic and economic performance of the types could not be assessed. Finally, villages were selected purposively, and the analysis covers high-altitude (EHAZ) sites in three territories; the results should not be generalized to other agroecological zones of South Kivu without further validation.
5. Conclusion
This study developed a typology of smallholder farming systems in the Equatorial High-Altitude Zone of South Kivu based on the adoption of sixteen sustainable soil and crop management practices by 374 households in Kalehe, Kabare and Walungu, combining principal component analysis, hierarchical and K-means clustering, bias-reduced multinomial logistic regression and constraint analysis. Four farmer types were identified: conservation-oriented systems (Type 1, 19.8%), soil-fertility systems (Type 2, 36.9%), integrated systems (Type 3, 11.2%) and soil-cover systems (Type 4, 32.1%). Practices were co-adopted in four families (resource-intensive, physical soil management, ecological regulation and foundational practices), showing that farmers combine practices into packages rather than adopting them in isolation.
Type membership was associated mainly with territory and farm-structural characteristics (land position, farm size, perceived soil fertility and, for Type 2, hired labor), and not with age, gender or farming experience. The constraints differed among types: lack of resources predominated in Types 1 and 4, lack of information in Types 1 and 2, high workload in Type 2 and lack of interest in Types 4 and 1, whereas Type 3 reported the fewest resource, workload and land-ownership constraints.
These results indicate that uniform extension strategies are poorly suited to these highland farming systems. Interventions could be targeted by type: access to resources and training for Type 1; labor-saving tools and techniques for Type 2; involvement of Type 3 farmers as peer trainers; and participatory testing of practices that address the preferences and resource limitations of Type 4. Future research should link typology to yield and income data, follow adoption over time and examine farmers' perceptions of the practices.